
CE-22PA1030X - Advanced Tableau®
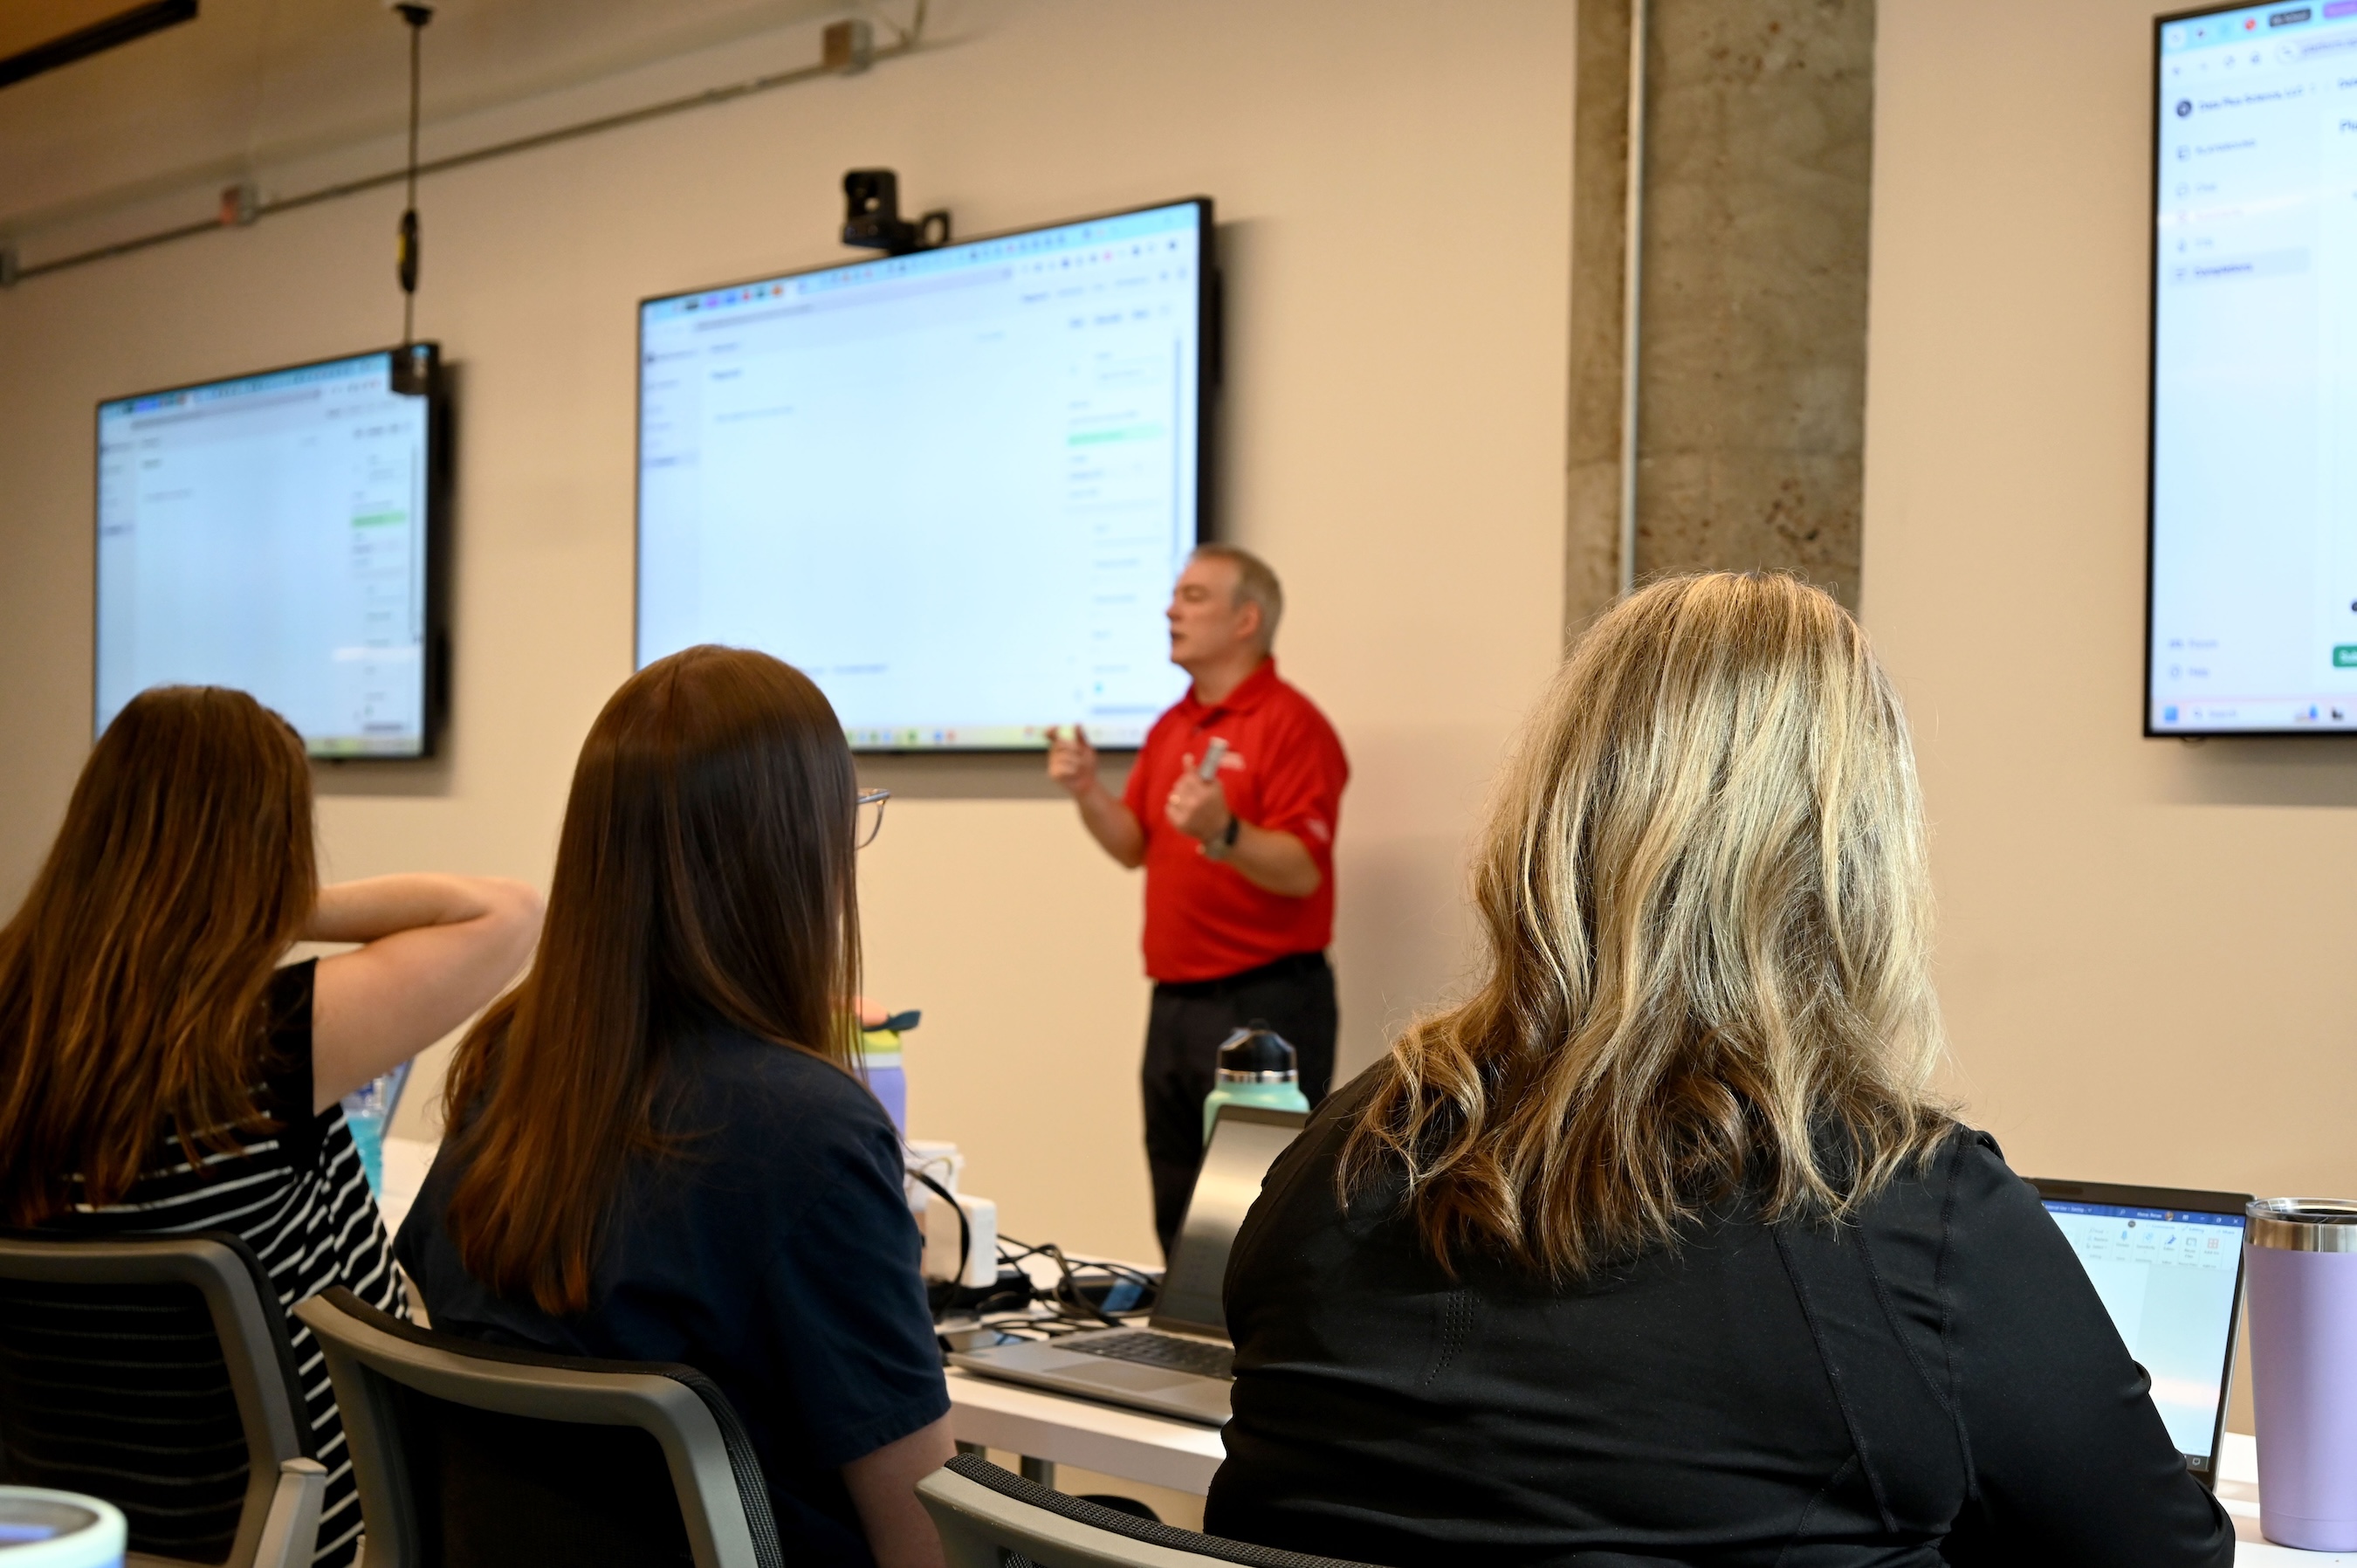
Advanced Tableau builds on Tableau fundamentals by exploring advanced techniques for creating sophisticated data visualizations and interactive dashboards. This hands-on course covers advanced calculations, Level of Detail (LOD) expressions, table calculations, parameters, set actions, mapping, data preparation, and dashboard interactivity. Learners explore best practices for designing high-performance dashboards, applying advanced visualization techniques, and transforming complex data into compelling, actionable insights for business decision-making.
Course Outline
Sessions 1 & 2
- Advanced calculations, table calculations, and Level of Detail (LOD) expressions
- Building advanced visualizations and analytical chart types
- Data preparation, joins, blends, unions, and JSON data sources
- Custom shapes, color palettes, and visualization formatting
- Advanced mapping techniques, custom maps, and spatial analysis
- Parameters, set actions, and interactive dashboard techniques
- Dashboard design, navigation, and user experience best practices
- Advanced chart types, including small multiples and waterfall charts
Sessions 3 & 4
- Advanced chart types, including bump charts, calendar heat maps, and Sankey diagrams
- Table calculations, forecasting, clustering, and statistical analysis
- Data densification and advanced date techniques
- Custom mapping with shapefiles, flight paths, and density maps
- Viz in Tooltip, dashboard actions, and interactive analytics
- Advanced calculations for dynamic analysis and reusable dashboards
Learner Outcomes
Learners who complete this course can expect the following outcomes:
- Build advanced, interactive Tableau dashboards using best practices in data visualization, analytics, and dashboard design.
- Apply advanced Tableau features and calculations to create sophisticated data visualizations.
- Apply advanced mapping techniques to visualize and analyze data.
- Use interactive functionality to create scalable, high-impact visualizations.
- Communicate data-driven insights effectively to support decision-making.
Who Should Register?
This course is designed for the following learners:
- Learners who have completed an Introduction to Tableau course.
- Tableau users with prior experience who are comfortable building basic dashboards and visualizations and want to learn more advanced chart types and techniques.
- Analysts and professionals looking to expand their Tableau capabilities and create more dynamic, interactive dashboards.
Additional Information
- A reliable internet connection and access to two screens are recommended to maximize the learning experience.
- The meeting invitation, Zoom link, and course materials will be sent to registered participants three to five days before the first session.
- Tableau® is a registered trademark of Salesforce, Inc. This academic course is not endorsed or approved by Salesforce.
Learners can take dashboards further with advanced calculations, visualizations, and interactive features. To broaden data visualization skills, learners can pair this course with Data Visualization Principles, Story Finding and Storytelling.
What You'll Earn
After completing all course requirements, learners earn the Advanced Tableau record of completion.
View the Advanced Tableau Badge
Learn more about UC Skills credentials on our credentials pageSelect a section to register
Center for Business Analytics and AI (CBAI)
The University of Cincinnati Center for Business Analytics and AI bridges academia and industry to empower professionals to turn data into action. Through applied learning, industry collaboration and access to academic and industry expertise, the Center helps organizations and professionals build capabilities in data, analytics and AI that accelerate business transformation.
The center brings together a robust community of professionals, faculty and students to exchange knowledge, explore emerging practices and solve real-world business challenges.
Through the Academy, professionals build practical, in-demand skills through hands-on training in business intelligence, data visualization, artificial intelligence, analytics and emerging technologies. Courses are designed for immediate application, helping participants strengthen their capabilities and drive impact within their organizations.
Carl H. Lindner College of Business
The Carl H. Lindner College of Business empowers business problem solvers to tackle the world’s challenges.
We fuel professional growth through our distinctive combination of academic and hands-on experiences: our problem-solving mindset, cooperative education, flexible pathways, inclusive community and vibrant, urban setting.
As the founder of cooperative education and consistently ranked Top 5 for co-op, the University of Cincinnati has exhibited its prowess for connecting students with top-notch employers. Co-op empowers students to explore career options, while building their professional skills, resumes and networks. Lindner is proud to further this powerful tradition.
Place, age or stage — students from a wide variety of backgrounds become problem solvers at Lindner. Begin your journey today.